I've literally looked through all of them. Placeholder for graphs
Friday, July 18, 2025

Saturday, March 4, 2023
You can do your own research and confirm the following statements for yourself
I will bet you money on this.
Doing your own research using supercomputers and a vast array of scientific information ...
Doing your own research using supercomputers and a vast array of scientific information at speeds our ancestors would find impossible to believe!
Including the ability to instantly create animations/movies illustrating the data, images and graphs, with a few clicks of a mouse or touchpad.
This is no fantasy, no science fiction imaginings, it's possible, and I do it every day. When I was young, before super computers even existed, it would take years to do what I can do in a minute now. And the results would have been a pathetic (by current standards) and boring. And on paper. And almost nobody would ever even look at it.
The sheer volume of information, easily displayed, is overwhelming. In 5 minutes I can easily gather and save enough information to write a thesis, including hundreds of graphs and an animation as well.
It's ironic that it's easier to gather the information now than it is to put it inane kind of framework/display to show somebody else. And since my experience is that almost NOBODY ON THE ENTIRE PLANET is interested, I rarely do. Looking at my blogs you can abundant evidence of this. But that is something almost nobody will ever do as well.
Like this blog post. The odds are NOT A SINGLE HUMAN WILL EVER READ IT, and if they do, they won't understand it, or care.
It's really just for my use. I am not kidding
Tuesday, February 21, 2023
Seawater colder than the freezing point of seawater
15 February 2016
A “supercoolometer”, a device that sounds like it should be used to measure hipsters, has found the coldest seawater on Earth, under Antarctic sea ice.
NIWA oceanographer Dr Craig Stevens and his team are researching why, in a warming world, sea ice is growing in the Antarctic even though it is receding in the Arctic. Sea ice growth is a vital part of the climate system that influences many aspects of life on the planet. The question is, are the giant ice shelves around Antarctica responsible for this paradox?
This year the team deployed a highly sensitive instrument called a supercoolometer as well as their usual array of ocean turbulence sensors. It was developed at NIWA by Matt Walkington to look at an often-ignored but possibly key part of the Earth’s climate system – seawater colder than freezing point.
Thursday, January 26, 2023
Monday, September 26, 2022
Taking on the complete nonsense that is claimed to be "climate science" --> Homogenization (written as homogenisation)
This is a time consuming idea, so this post is a bookmark at the moment.
https://variable-variability.blogspot.com/2012/01/homogenization-of-monthly-and-annual.html
https://variable-variability.blogspot.com/2012/01/new-article-benchmarking-homogenization.html
For starters Googles Ngram viewer can find no books that have the word "homogenisation" in them.

Tuesday, April 5, 2022
GHCN data graphs from the actual raw data pulled from the GHCN website
Graphs that show unadjusted temperature data are generated by my humble person, using software created by Tony Heller that uses the raw data online from the GHCN (global historic climate network)
A few examples of what is possible with just a mouse click


Many interesting things show up in the actual data, unlike the GISS/NOAA/HADCRUT/BEST "data", which is adjusted, homogenized, corrected and altered so much it no longer resembles actual measurements of weather, but appears as computer modeled "data", that does not match any real set of measurements.
Some examples are extremely obvious, while others are subtle, but all of the "adjustments" make any and all actual weather data appear to be the same, and almost all of it creates an illusion of unusual warming.
I should do an entire blog on just this sort of thing.
Tuesday, March 29, 2022

Tuesday, January 18, 2022
Fact checking the GISS climate data (updated September 30 2022)
It's very easy to do, but time consuming to show it, explain it, and get a blog post right to argue the case. Hell, it's like writing a thesis.
Started a blog that is mostly just posting the data used in this onerous effort
https://whyidonotbelieveyou.blogspot.com
Saturday, June 4, 2016

Monday, January 18, 2016
Global Temperature data, the Satellite data matches the surface records
Currently (Jan 18 2016) there are stories that somehow the Satellite data isn't accurate. It seems this is due to the Satellite record not showing the same global warming that GISS, NOAA and maybe the CRU data analysis show is happening.
Something like this seems easy enough to check, so I did.
Using the NOAA Climate at a Glance data, and the NOAA Satellite data I simply compared the two, and they match up.


Something like this seems easy enough to check, so I did.
Using the NOAA Climate at a Glance data, and the NOAA Satellite data I simply compared the two, and they match up.


Monthly, seasonal, or annual, they all match.


So why would anyone say they don't?
Monday, May 18, 2015
How to know BEST is wrong about how they adjust the past
While all the surface data is adjusted, BEST is an easy target, Fish in a barrel actually.
Here is the actual data, from GHCN


Here is the actual data, from GHCN

Location

Dale Enterprises is a quality controlled station with no changes, aside from adding an electronic sensor in 1995, but they kept the old mercury instruments as well.
This is what Watts showed in 2010, about the USHCN adjustments

Here is the current GHCN adjustment, using the BOM tool

Compared to the actual data

And here is what BEST did to the data


Just awful "science" at work there. Instead of using a quality station to adjust the bad stations, they adjust the good station to match the bad ones.
Here's a nearby bad station moved next to water treatment plant, showing a drastic increase in the trend.


Google maps of water treatment plant where that station rests.
BEST and the rest of the data analysis adjusted the good station, not the bad ones.They are wrong, but they probably don't even know it.
Sunday, April 26, 2015
Richard Muller was never skeptical?
Really?
By Richard Muller on December 17, 2003
That is strange.
By Richard Muller on December 17, 2003
Let me be clear. My own reading of the literature and study of paleoclimate suggests strongly that carbon dioxide from burning of fossil fuels will prove to be the greatest pollutant of human history. It is likely to have severe and detrimental effects on global climate. I would love to believe that the results of Mann et al. are correct, and that the last few years have been the warmest in a millennium.
Archived here (the page is excluded from the archive.org)
11/03/11“It is ironic if some people treat me as a traitor, since I was never a skeptic”
Archived here
That is strange.
Thursday, April 23, 2015
Thursday, March 19, 2015
Friday, February 6, 2015
Just another little deception by the LA Times
The headline isn't actually a complete lie,
Satellite images show a greener California but a shrinking snowpack
but the take away message, hammered home by the images is clear. The thing is, it's not the whole story at all.

So little snow! Of course they cherry picked the 2014 image to make it look bad in 2015, but a quick check of the actual data reveals the deception. They used Feb 1 2014, because it was right after a heavy snowfall. Looking at the snow using Worldviewer makes it pretty clear that it's a deceptive tactic.
Jan 2014

Jan 2015

Jan 2014

Jan 2015

An update later in February should really hammerpunch this home. Not that the facts will matter at all.
Monday, December 15, 2014
Why there has been a pause in global warming
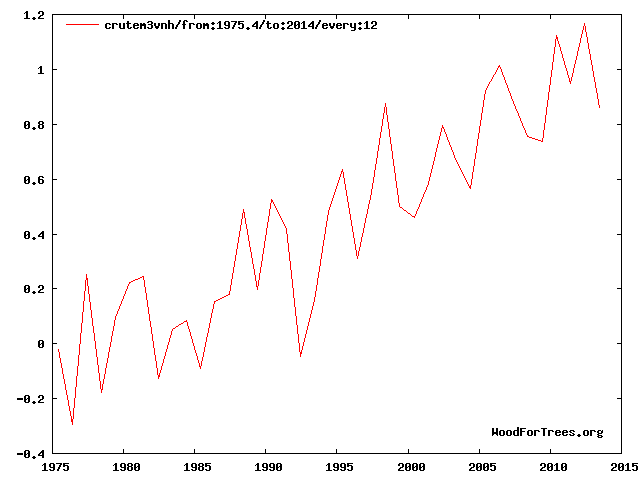
The "pause" is due to boreal winters cooling, which is evident in the following NH land only data from WFTs, using the crutem3 data. Here is the annual data, by year.

Here is each month.

It's almost impossible to see the woods for the trees, so here's the monthly data, clearly showing how only the boreal winter is cooling.
April

May
June

July

August
All the NH warm months show warming.
But December does not.

And January shows cooling

February shows cooling

It is the extreme cooling of the NH winters that has caused the pause. You now know more than most people at this point in time.
Sunday, December 14, 2014
How can you know the US is not experiencing global warming? Let me show you.
Go to the CAG page and select the trend. See for yourself.
Using 1988 shows a cooling trend. Using 1995 really shows it. And using 2002 will freak most people out.
1995-2014 Minimum temperature trend -14.75 F a century

1995-2014 maximum temperature trend - 9.54 F a century

If you are freaking out, just select 1970 and you will feel warmer.

Using 1988 shows a cooling trend. Using 1995 really shows it. And using 2002 will freak most people out.
1995-2014 Minimum temperature trend -14.75 F a century
1995-2014 maximum temperature trend - 9.54 F a century
This is the cherry picking way to assure everybody things are warming up. It's complete nonsense, but if it makes you feel warmer, then who am I to hammer punch you with some facts?
The astute observer who understands global warming will note that the min trend far exceeds the max, which is completely against the global warming theory; This might be explained here.
More facts that won't really matter (cooling boreal winters)
That the boreal winters have been cooling is pretty much a known fact among researchers. The reason for this is currently anything but settled science. These papers show why it's a fact.
Observed and simulated temperature extremes during the recent warming hiatus
Complete paper here (full paper pdf)
Trends in hemispheric warm and cold anomalies (full paper pdf)
Recent Arctic amplification and extreme mid-latitude weather (full paper pdf)
Arctic warming, increasing snow cover and widespread boreal winter cooling (full paper pdf)
Decadal Fluctuations in Planetary Wave Forcing Modulate Global Warming in Late Boreal Winter
Observed and simulated temperature extremes during the recent warming hiatus
Complete paper here (full paper pdf)
Trends in hemispheric warm and cold anomalies (full paper pdf)
Recent Arctic amplification and extreme mid-latitude weather (full paper pdf)
Arctic warming, increasing snow cover and widespread boreal winter cooling (full paper pdf)
Decadal Fluctuations in Planetary Wave Forcing Modulate Global Warming in Late Boreal Winter
Full paper PDF
This paper may explain why it's happening.
Shortwave and longwave radiative contributions to global warming under increasing CO2 (full paper pdf)
The short version is this. CO2 trapping of infrared radiation is not the ultimate cause of global warming. (this is in the paper)
It's the feedbacks from the initial warming (from CO2) that models show will cause the expected warming. These feedbacks result in short wave (visible light) causing the expected warming, as there is less snow, ice and sea ice reflecting it back into space.
If this study is correct, then it could explain why the boreal winters have been cooling. Because instead of less snow and ice, there has been more, leading to that drastic January and February cooling trend.
This paper may explain why it's happening.
Shortwave and longwave radiative contributions to global warming under increasing CO2 (full paper pdf)
The short version is this. CO2 trapping of infrared radiation is not the ultimate cause of global warming. (this is in the paper)
It's the feedbacks from the initial warming (from CO2) that models show will cause the expected warming. These feedbacks result in short wave (visible light) causing the expected warming, as there is less snow, ice and sea ice reflecting it back into space.
If this study is correct, then it could explain why the boreal winters have been cooling. Because instead of less snow and ice, there has been more, leading to that drastic January and February cooling trend.
Subscribe to:
Posts (Atom)